Home automation with Influxdb and Grafana
I recently saw nice home automation dashboards made using grafana… wanted to give it a try!
Grafana itself is only the tool for displaying the data. The storage part is typically implemented by InfluxDB, a time series databases like RRDtool.
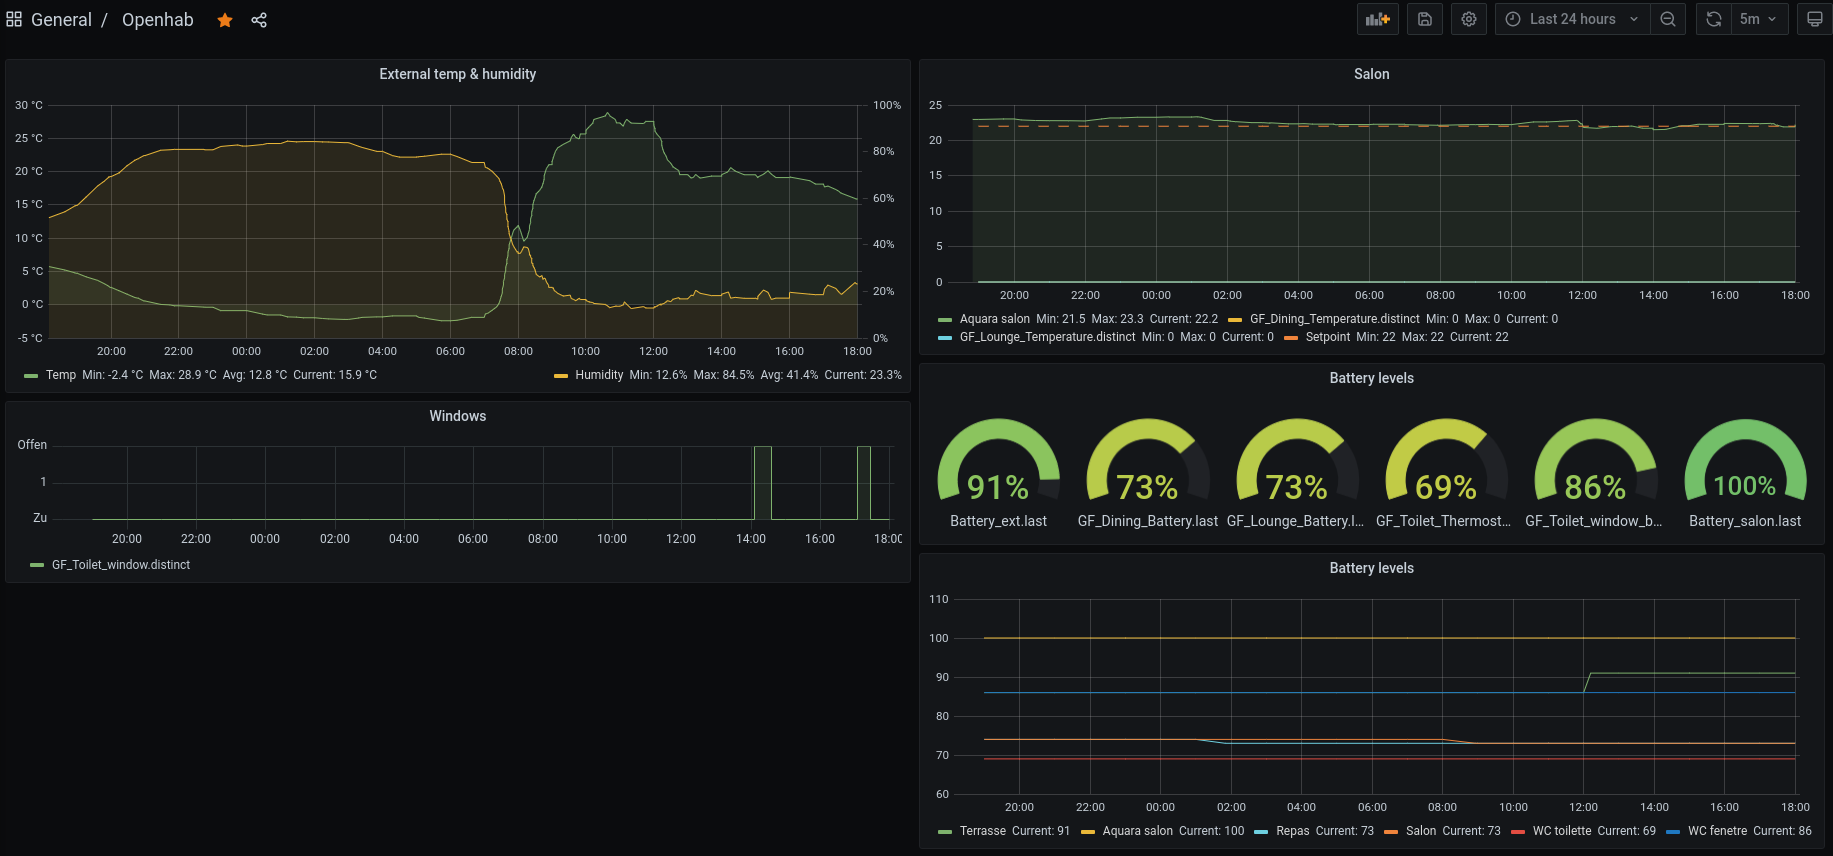
Actually, openHAB can use InfluxDB to store data from the sensors (see data persistence feature). Setting up InfluxDB storage was a matter of few minutes and the database was starting to fill up. Dashboard in Grafana was also quickly set up
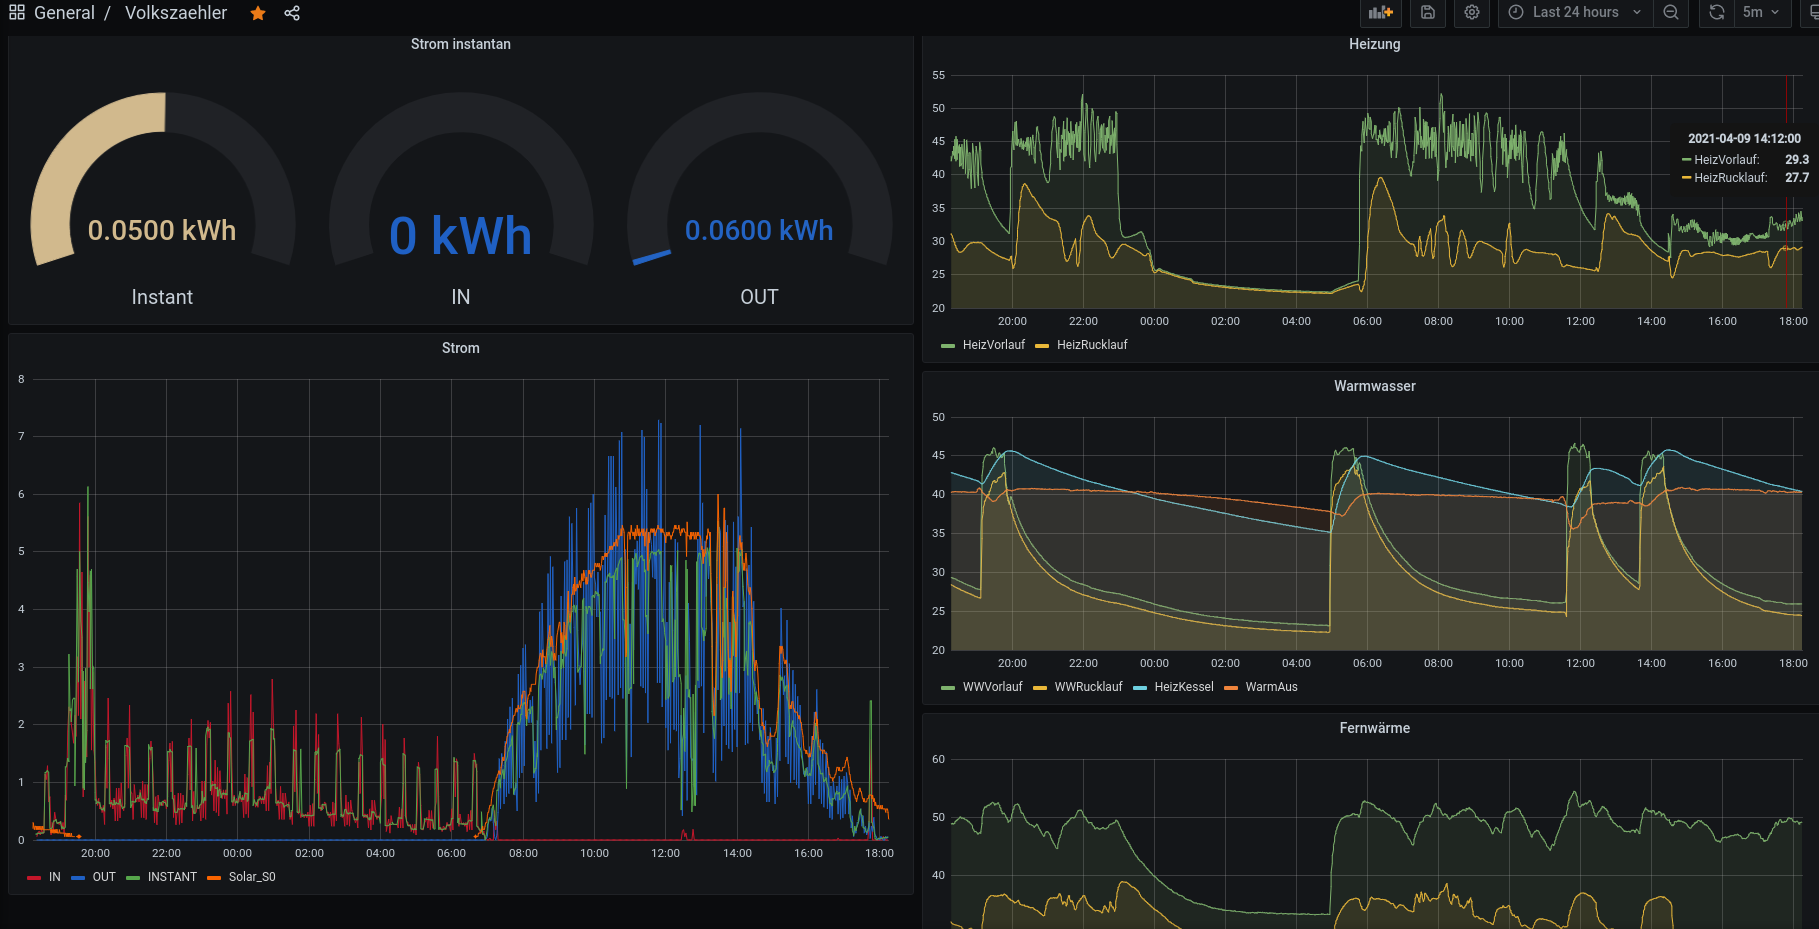
Volkszaehler, which I’m using for the power, solar and heating data acquisition was more complex to set up. First, I had to update the software itself (last update was made back in 2018), along with switching raspbian to the stretch release! Only then the vzlogger offered the influxdb backend.
Displaying the heating information (temperature values) was not complicated. For power values, it became a bit more complex - the stored values from the power meter are absolute values. Thus the graph should display the difference between the database entries in order to get the expected curves. The solution is to compute the derivative(1m) if the value series, and then multiply the result by 60 (60 minutes in 1h) to get kWh values.
The computation of the solar production was even more complex, as the time series store the S0 impulses. Therefore, the values stored are always “1”. What matters is the time difference between the records. This function seems to work, though I’m not sure I can fully explain why :-) :
SELECT sum("value") *60/1000 FROM "Solar_S0" WHERE $timeFilter GROUP BY time(1m) fill(null)
The final dashboard looks fine for now