Monitoring Logfiles With Graylog
With more than 20 servers and VMs running, I started loosing overview of what was happening on all systems. Skimming through 20+ emails from logwatch everyday without really reading them, disks filling up, emails stuck in the queue… time to do something about it !
Actually there are two topics that are not covered by the same tools:
- checking for particular messages in the logfiles
- looking at metrics like free disk space, memory and CPU usage
Today I’ll focus on the logfiles monitoring.
There are many available tools to monitor logfiles:
- the ELK stack (Elasticsearch, Logstash, Kibana)
- prometheus (from the makers of grafana)
- Graylog
ELK seemed overkill to me, especially regarding the needed resources to operate it.
In the end I decided tio go with Graylog.
Forwarding Logs to Graylog
One solution is to tell rsyslogd to forward the entries to a remote server. Nowadays, journald should replace (s)syslogd, however Graylog doesn’t provide an importer for journald, and recommends to use an import script from ELK… which was not modified for some years !
Decision was to stay with rsyslogd.
Other possibility : https://github.com/parse-nl/SystemdJournal2Gelf
Looking for problems
Now that logs were being forwarded to Graylog, I’ve added alerts when keywords error, fail, denied, deferred (mails), unreachable, Started Session of user root (aka root login)
In case one of these words is found, an alert is sent by email and through telegram
Improve signal to noise ratio
Looking for these keywords triggered by far too many alerts. Postfix, dovecot and ssh were reporting many failing connection attempts, tailscale also sometimes has hickups, DNS requests time out, docker reporting network interface down when containers is restarted …
In a first step I’ve tried refining the filters, like “error” AND NOT (“Disconnected: Connection closed” OR “Connection reset by peer” OR “SSL routines::sslv3 alert bad certificate”), but it is clear that this will not scale at all.
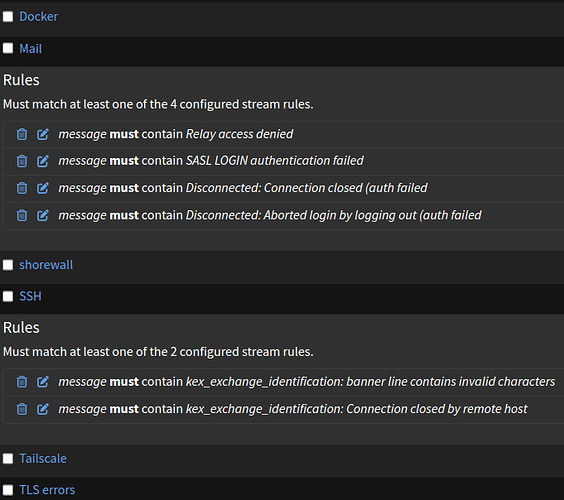
Final solution was to derive some specific stream out of the default stream. If a message matches certain rules, it is removed from the default stream and move to another stream. There can be many streams, and for each one, there can be many rules (that have to be OR’ed instead of the default AND operation). I’ve created streams like Email, SSH, docker and incrementally added rules to extract unwanted messages.
In the Graylog forums, processing pipelines are mentioned as an alternative. They are used to add predefined fields to the messages dependign e.g. on their content. Later on, filtering and selection can be performed by including these fields in the selection criterias.
What’s going on my systems
The whole process gave many insights of what’s going on the systems. These activities are by far not caught by logwatch, are are going mostly unnoticed.
- Network issues : connectivity loss, DNS, timeouts etc
- Various connection trials on SMTP and IMAP
- Newsletters being sent with return-path on a non-existing domain
- Intermittent SATA link failures
- Snap daemon failing to contact it’s update server
- Similar events with watchtower failing to check for docker containers update
Alerting
Graylog provides several possibilities of sending alerts, unfortunately no matrix client. I have choosen to send notfications per email and through a telegram bot+channel.
I also adapted the alert message templates in order to have the original message at the beginning of the notification rather than at the end - why have to scroll all the way down, while some unnecessary meta information is located on top ?
The alerting is not 100% reliable, some emails and alternating some telegram messages don’t always reach me.